Food Inspection Analytics
A data engineering platform that unifies food-safety inspection data from Chicago and Dallas into a Medallion (Bronze→Silver→Gold) lakehouse, powering cross-city compliance and risk-hotspot analytics in Tableau.

- 2
- Cities unified
- 2
- Source shapes
- 3
- Medallion layers
- 25
- Dallas violation blocks
- 5
- Gold entities
- 4
- Star dimensions
The problem
Two shapes, no shared schemaChicago
LongChicago Department of Public Health
Violations arrive as
Every violation packed into one pipe-delimited string
Severity
Rates the establishment Risk 1 to 3
Needs
Parse
- Violations need regex parsing out of free text
- No per-violation severity at all
- ZIP codes arrive as floats
Dallas
WideDallas Code Compliance Services
Violations arrive as
Up to 25 numbered blocks spread across dozens of columns
Severity
Assigns numeric point deductions
Needs
Unpivot
- Coordinates nested inside a lat_long object
- Violation blocks thin out sharply after the first few
- Numbered blocks must be unpivoted to a long shape
Two cities publish restaurant inspections, and neither publishes them the same way. Chicago packs every violation into one delimited string; Dallas spreads them across 25 numbered columns, and nothing about reading one helps you read the other. They do not even measure danger at the same level: Chicago grades the establishment, Dallas assigns points. Every design choice below follows from that.
Architecture
Two lanes, one join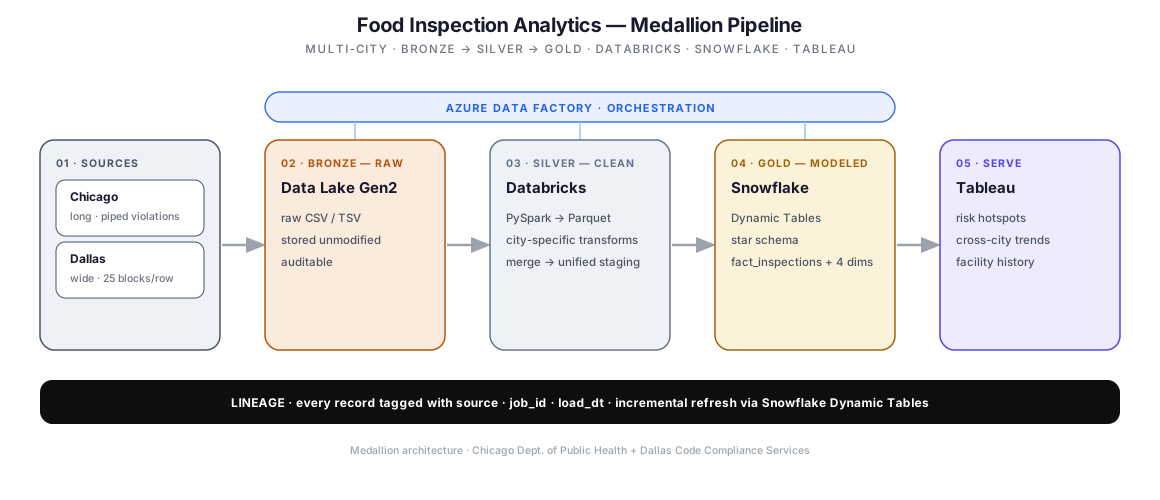
Profiling
What it changed| Found | Detail | Action |
|---|---|---|
| Dallas violation block sparsity | 92% populated at block 1, 13% at block 10, under 1% from block 17 | Unpivot only blocks that carry data, per row |
| Chicago violation strings | Pipe-separated free text, several violations per inspection | Regex parse into code, description, comment |
| ZIP codes | Stored as floats, arriving as 60614.0 | Cast, strip non-digits, zero-pad to five |
Profiling ran before any transformation was written, which is the only reason the Dallas unpivot is selective. Melting all 25 blocks would have multiplied row count for columns that are over 99% empty.
Six stages
Decisions, not descriptionsArrow keys to step
Ingest
Azure Data Factory
- Both cities landed unchanged
- Azure Data Lake Gen2 as the raw store
- Pipeline control and scheduling in ADF
Decision
- Chose
- Land each city in its own native shape
- Over
- Conform to a shared schema on ingest
Because
- Conforming on ingest destroys the evidence when a parse is wrong
- The two shapes need different logic, and that belongs downstream
- Re-processing never re-downloads
Cost
Two divergent shapes to carry until the silver layer.
- Bronze
- layer
Governance
Layers and lineageWhy three layers
- Clear separation of concerns
- Reprocessing without data loss
- Scalable to more cities or years
- Audit-friendly and production-ready
Bronze is never rewritten, so a wrong regex costs a rerun rather than a re-download and a lost original.
Stamped on every record
- job_id
- Unique pipeline execution that produced the row
- load_dt
- Ingestion timestamp
- source
- Which city the record came from
Three columns are the difference between rerunning a job and opening an investigation into which one produced a bad row.
Stack
Everything usedOrchestration
- Azure Data Factory
- Azure Data Lake Gen2
Processing
- Databricks
- PySpark
- Regex parsing
Warehouse
- Snowflake
- Dynamic Tables
- Incremental refresh
Modelling
- ER Studio
- Star schema
- Medallion architecture
Profiling
- Alteryx
- ydata-profiling
- Excel
Serving
- Tableau